Testing Differences Between Proportions
Consider a study showing that 65% of 43 people aged 18 to 24 prefer Coca-Cola compared to 41% of 39 people aged 25 top 29. If we wish to test whether the difference between these proportions is significant, we need to compute a p-Value (see Formal Hypothesis Testing for a general discussion of the logic of statistical testing).
Most introductory statistics course and textbooks present a standard formula for computing statistical significance between proportions. This formula is rarely used in commercial survey analysis as it makes a series of assumptions that are not consistent with real-world data sets. The rest of this page discusses other tests of proportions that are designed to overcome these limitations.
The standard test of proportions
Introductory statistics course and textbooks present a standard test of the difference between proportions.
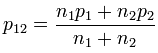
Where ![]() and
and ![]() are the two proportions and
are the two proportions and ![]() and
and ![]() are the sample sizes:
are the sample sizes:

where:
- z is evaluated using a standard normal distribution.

and
The analysis of weighted data
The standard test makes a technical assumption known as [i.i.d.]. When data is weighted this assumption is violated.
The most straightforward modification of the test in this situation is toe replace the sample size by the Effective Sample Size and to compute ![]() using the weighted sample size. This approach is adopted by most of the widely used commercial market research programs (e.g., SPSS IBM Data Collection Model programs, Uncle, WinCross, CfMC, Quantum), although sometimes with additional minor variations (e.g., Yate's correction). These programs also commonly treat the test-statistic as a a t-statistic, variously computing the number of degrees of freedom as the sum of the effective sample sizes and minus one or minus two.
using the weighted sample size. This approach is adopted by most of the widely used commercial market research programs (e.g., SPSS IBM Data Collection Model programs, Uncle, WinCross, CfMC, Quantum), although sometimes with additional minor variations (e.g., Yate's correction). These programs also commonly treat the test-statistic as a a t-statistic, variously computing the number of degrees of freedom as the sum of the effective sample sizes and minus one or minus two.
A more rigorous approach is to use special-purpose algiorit
(see for the discusses the basic logic used when comparing proportions. This page describes
consider themselves to be politically disenfranchised compared to 25% of people aged reported the following results:[1]
| Chinese | Mexicans | |
|---|---|---|
| Believe they have minimal say in "getting the goverment to address issues that interest" them |
56% | 25% |
| Sample size | 499 | 287 |
References
- ↑ Wand, Jonathan. (2012 Conditionally Accepted) “Credible Comparisons Using Interpersonally Incomparable Data”. American Journal of Political Science, Table 2.