PowerPoint Export
When you click Export > PowerPoint, Displayr gives you a choice between Create new document or Update existing document. You can also select whether to export all pages or only the selected pages.
Create new document
When you select Create new document, Displayr creates a new PowerPoint file (.pptx) that is a snapshot of the page(s) or the entire document at the time of export. Hidden pages and hidden items on pages are not included in the export.
By default, charts and visualizations are exported as images. However, you can instead export as editable PowerPoint charts by clicking on the chart and setting Properties > POWERPOINT EXPORT > Format to Microsoft Chart. By default, Displayr will export to a similar chart type in PowerPoint (if it exists). However, you can override this by selecting additional charts types from Export as. Once changed you can set changes for the entire document by clicking on 'Set as default'. You can add your own custom chart templates by creating Chart Templates in PowerPoint and uploading them to your Displayr Cloud Drive.
Standard Displayr Tables and Crosstabs are exported as PowerPoint tables. R-Outputs displayed as tables can be exported as images or tables. The default setting is 'image'. You can change this by clicking on the R-output table and setting Properties > POWERPOINT EXPORT > Format to Table.
You can make edits to exported tables in PowerPoint. On updating the PowerPoint document (e.g. with if the data has changed), most edits to the table made in PowerPoint will be retained.
Update existing document
When you select Update existing document you then need to drag-and-drop, or, upload, an existing PowerPoint file (.pptx). The contents of this file can then be automatically updated based on the charts, tables, data, text, and images in the Displayr document.
Edits to tables that you would "reasonably expect" to be preserved when updating will be, e.g. table location, size, layout, fonts, shading, borders. Significant structural edits made in PowerPoint will not be be preserved on update e.g. adding in blank rows or columns, deleting rows or columns. If you make structural changes in Displayr (e.g. add/remove rows, columns, spans) these will be reflected on updating the table in PowerPoint.
Updating is based on GUIDs
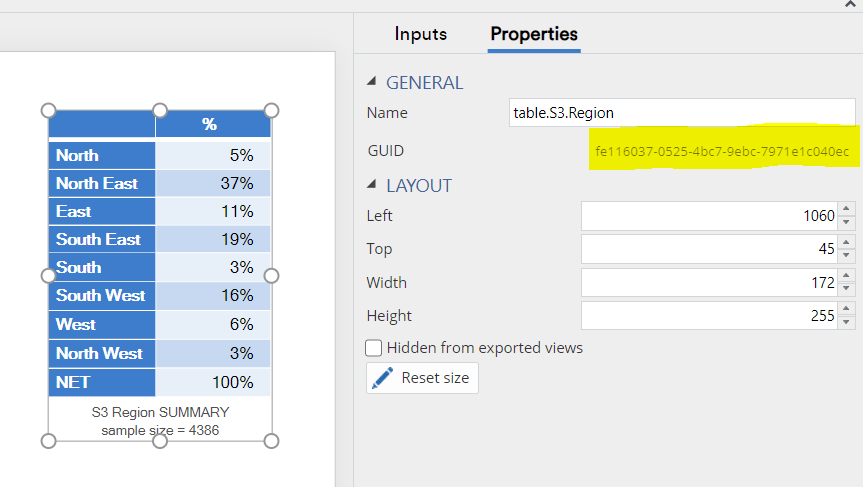
Every object that can be updated from a Displayr document has a GUID (Globally Unique Identifier code). This GUID is shown in Properties > GENERAL > GUID (see the yellow region below). You can select it using your mouse by clicking and dragging. It can be copied by right-clicking and selecting Copy.
GUIDs are recorded in the PowerPoint Alt Text field
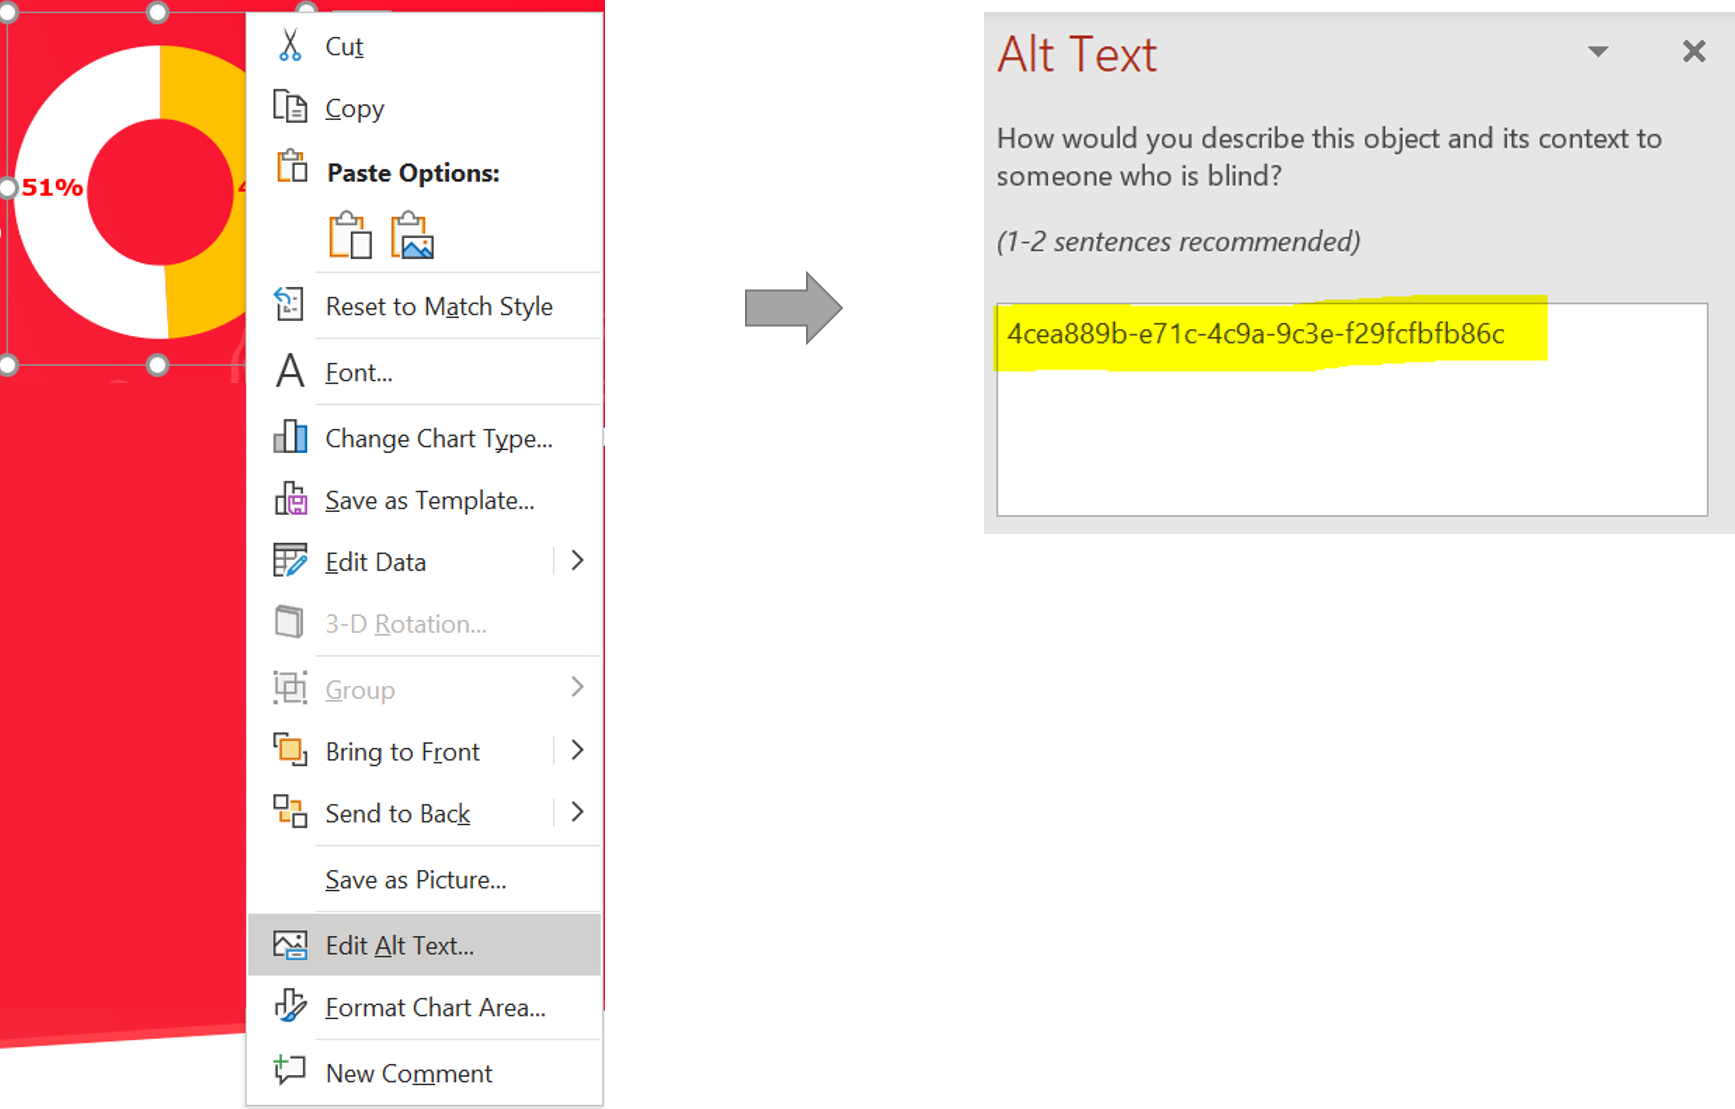
In order for Displayr to update something in PowerPoint, it is necessary to record the GUID in the Alt Text field in PowerPoint. This field is accessed in PowerPoint by right-clicking on things (e.g., a chart), and selecting Edit Alt Text.... Then paste the GUID into the Alt Text field.
PowerPoint Update controls
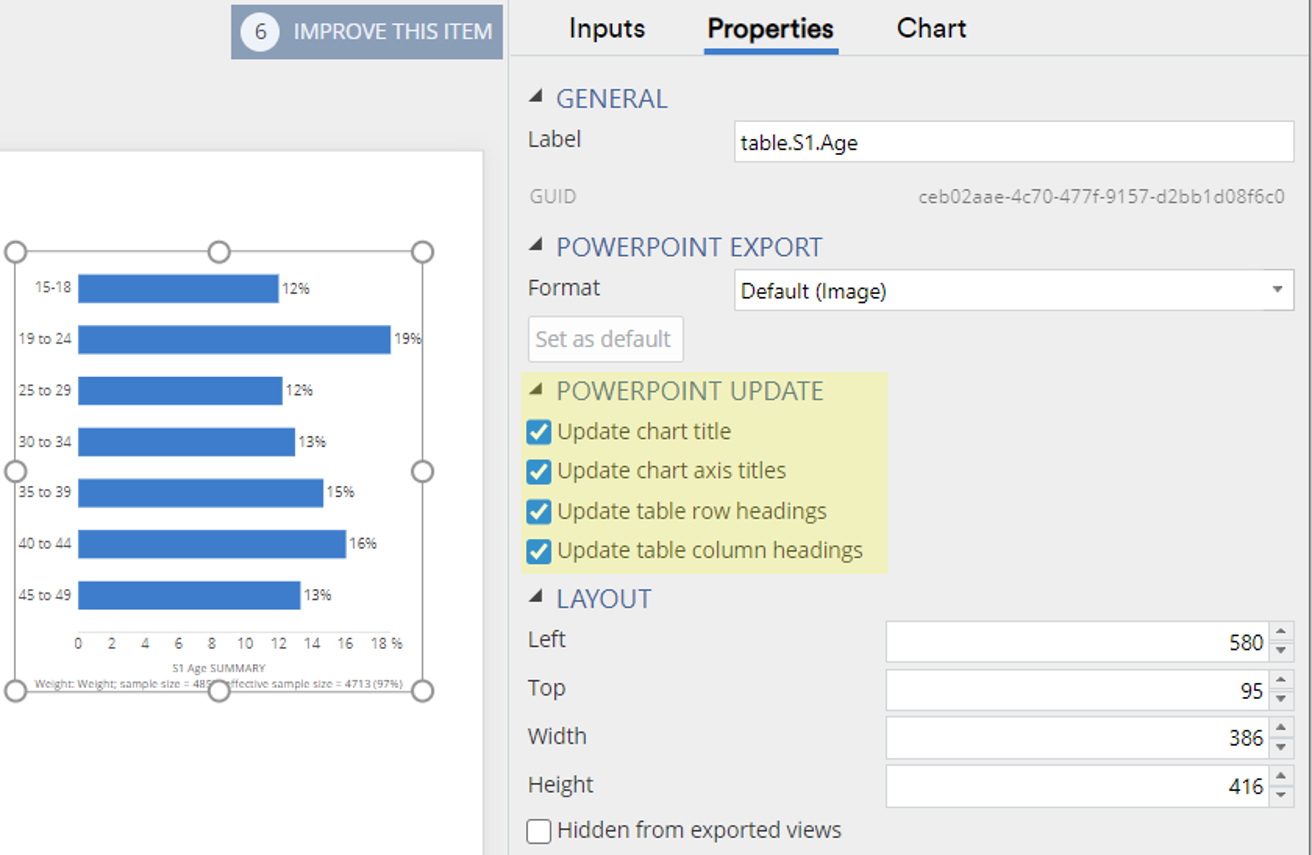
When updating a PowerPoint chart you can control the updating of chart titles and axes (yes/no). For example, you may have over-written a chart title in PowerPoint, and want to retain that edit on future updates. The same applies to row and column headings on tables.
Technical details
- Font styling on exported PowerPoint tables will be preserved only if Appearance > Highlight Results > is set to None or Compare columns (font colours highlighting significant differences will override manual edits)
- Color emojis in your document will appear in black and white in the export.
- If calculations in a document are out of date, you will be given the choice of whether or not to update them.
- Information other than the GUID can be stored in Alt Text. Whatever else is in the field, Displayr will find the GUID if it is there.
- If you find that things haven't updated that you expect to update, check that you have selected the relevant pages in Displayr or set the export to Export All Pages.
- New chart formats introduced in Office 2016 are not currently exported (i.e., Treemap, Sunburst, Histogram, Box & Whisker, Waterfall, and Funnel). Note though that Waterfall and Funnel can still be created as stacked column and bar charts with blank categories.
- Displayr supports charts types that do not appear in the main PowerPoint chart list (Pyramid, Cone, Cylinder, exploded pie/doughnut). PowerPoint now deals with these in the editing suite - for example, the chart format might be column or bar but you can set the series to appear as Pyramid, Cone, etc. You can export these charts as images or export them to PowerPoint as a chart, (Match Displayr). If exported as charts they are still editable and can be updated.


